Using DDS method computer modeling of spiral bevel and hypoid gears.
DDS method can be used for just any kind of calculations for spiral bevel and hypoid gears. Tooth contact analyses (TCA) is the most complicated part of calculation. The cost of software to do that runs over $100,000.00. They call it the state of the art software but non of them can do what DDS can. DDS method allows to do the job better and more cost effective. The images below are good example of it.
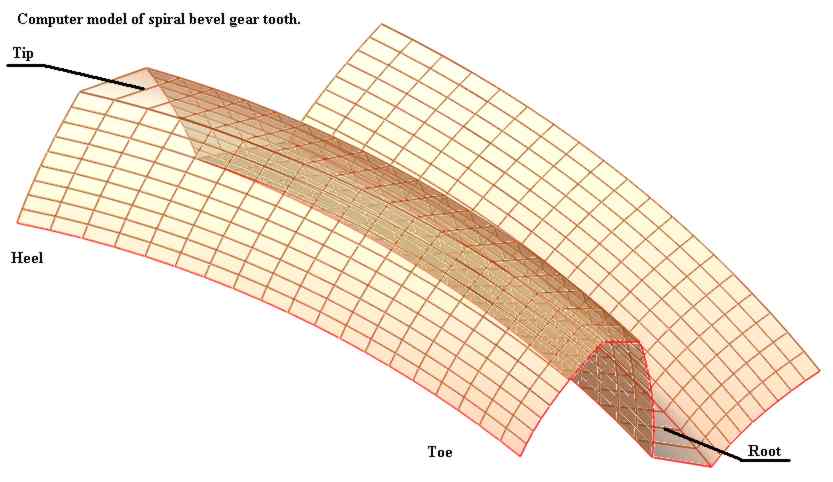
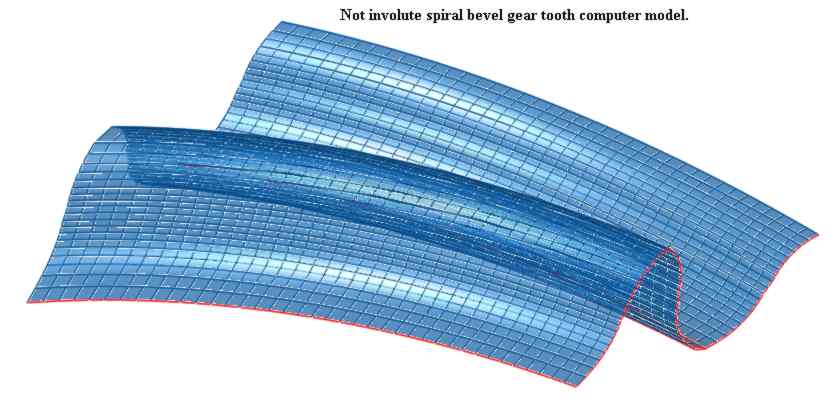
DDS (Direct Digital Simulation) has a unique capability to create digital models of the gear tooth surface as well as the gear blank. It can also mesh the gears and show tooth contact.
(Click here to see high ratio hypoid gear model.)
Here are some outputs from a simple computer program based on DDS.
1. Gear cutting machine summaries are used as input data for calculation of gear and pinion tooth surface geometry.
DDS allows calculating as many surface points as necessary for a regular tooth profile as well as for any other profiles. The cutter geometry does not make any difference for the calculation technique.
2. TCA.
DDS can take theoretical tooth surface data from #1 or data taken from mesuring gear and pinion tooth surfaces on CMM.
Here are some examples what can be calculated for a set of gear-pinion tooth surface data.
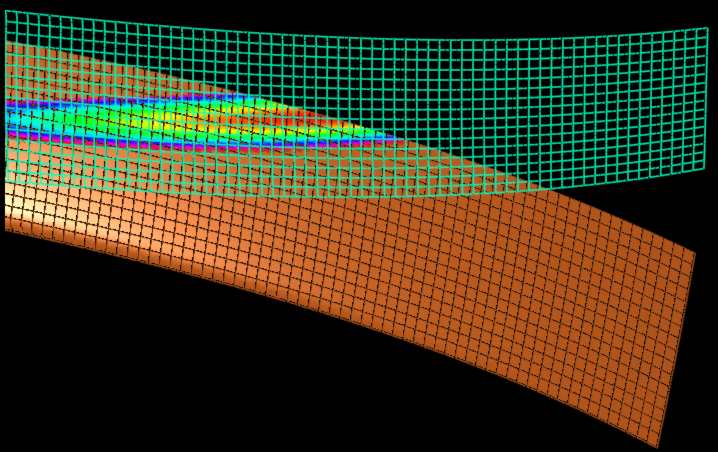
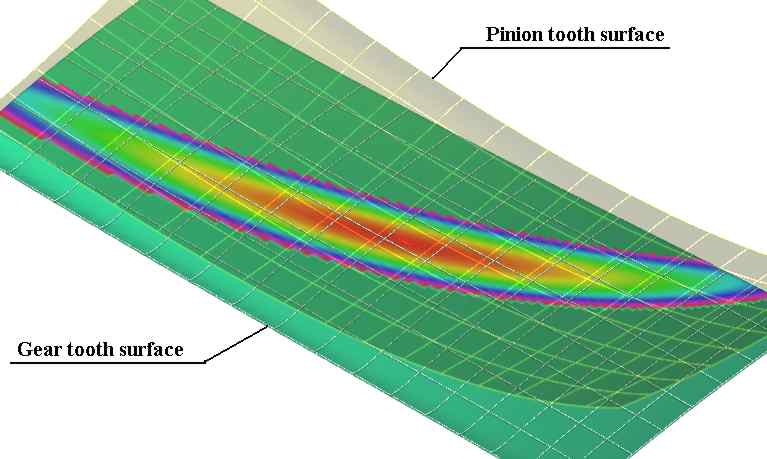
This is a colour presentation of distances between gear and pinion tooth matching tooth surfaces. Diffrent colours show different distances.
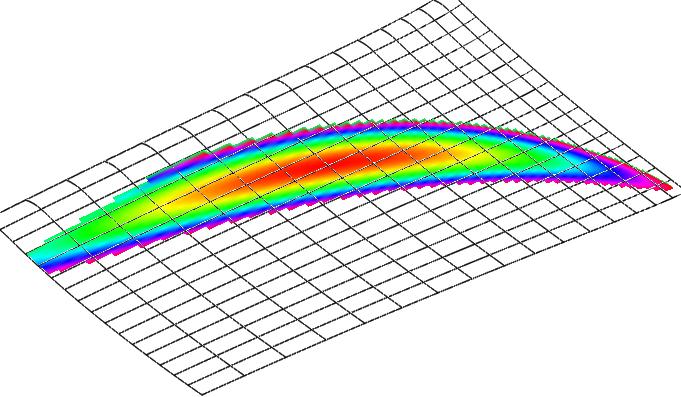
DDS can show 3D images in rendering or in weir frame mode. It can also show gear and pinion tooth surfaces together.
DDS can also show all the pictures in animation. However DDS can also show things in old fashion way. Here is a summary of contact on the gear in flat mode.
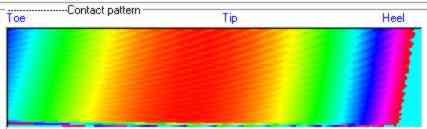
DDS calculates areas on the tooth surface (sq. mm.) for each color.
The following outputs can be helpful for gear noise and lubrication analyses.
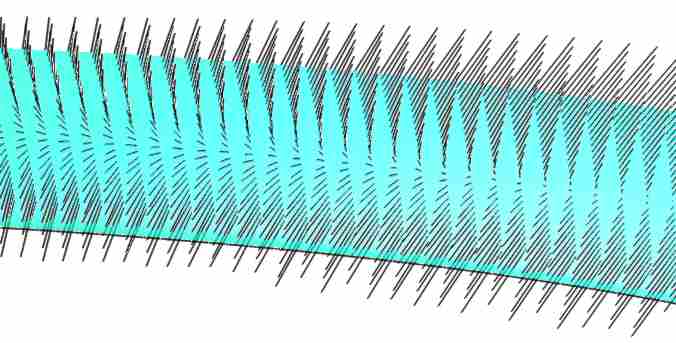
The black lines on the picture are tangent to the gear tooth surface. Each line represents direction and value of sliding velocities between gear and pinion tooth surfaces.

The red lines show directions and velocities of approaching the pinion tooth surface to the gear tooth surface.
What else needs to be calculated for spiral bevel and hypoid gears? Please send your ideas and questions to zak@zakgear.com.
Boris Zak and Stepan Lunin.
June, 2000
Click hear to see Gif animation of high ratio hypoid gear set.